Tracking where your time went with Lego workstream visualisation
How much of your time do you spend on planned work? The work which you set out to do today?
I worked with a team that quantified this number and focused their process improvements on moving that figure upwards.
It took us a while to figure out an effective way of tracking it.
At first, we tried putting tally marks on a whiteboard. Each representing how we spent our time that day. That worked for a while until we started to run out of whiteboard space. Next up we tried an Excel document, but no one looks forward to tracking their time in an Excel document. We wanted something visual and tactile. Something that would cause conversations to happen and be fun to use.
The answer was Lego bricks.
But first, we had to figure out a vocabulary to talk about how we were spending our time.
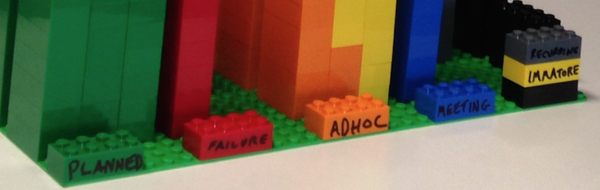
We came up with four categories of work, then chose a Lego colour to represent each type of work.
- Planned Work (green): This is value adding work which you had planned to be working on now and next.
- Failure Demand (red): Failing to do the work right the first time
- Adhoc Demand (orange): Value-adding work that you didn’t plan to do
- Meetings (blue): Time spent talking about the work
Planned work should be obvious; it’s helping you reach your current goal. But failure demand is a bit trickier. Having to fix bugs that have escaped into production is one type. There’s another more insidious variant: failure to understand the requirements the first time. This manifests in delivering the wrong features and having to do remedial work to fix the software.
Adhoc demand you will be painfully familiar with. It’s when someone smarter dressed then you approaches and says:
Them: “Hi, I’ve got a big favour to ask. Can you run a report on how many people under 25 bought a red car in Edinburgh last year, broken down by quarter?”
You: “Err. sure”
Them: “Great, I need it by 4 pm today for a big meeting. You’re the best. Thanks!”
There goes your afternoon.
These requests have value. But too many of them can slow your team down. Meaning you don’t deliver on the more significant ticket items that you’ve been tasked to provide.
At first, we tracked other types of work, but it turned out we spent hardly any time on them. So we stuck with the main four types of work.
The process for tracking time was this:
- Twice a day, consider how you spent the last four hours. Take four bricks that represent how you spent each hour of your time
- At the end of the day have a quick 5-minute retro where the team gets together to share their day in different coloured Lego blocks. Focus the chat on removing failure demand and how to improve how the team will spend tomorrow.
- Take all the blocks and put them onto columns on a board representing the week
- At the end of the week take note of the time spent in a spreadsheet then start a new week.
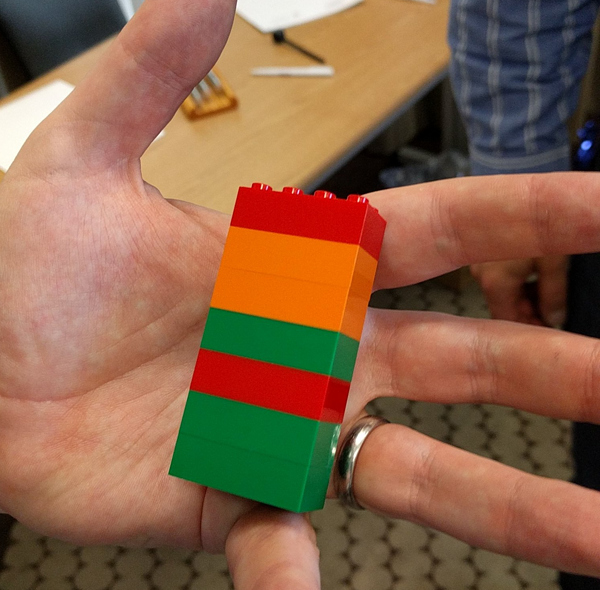
Here’s an example of one day:
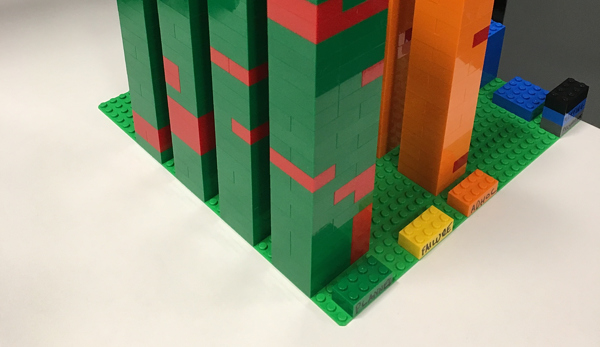
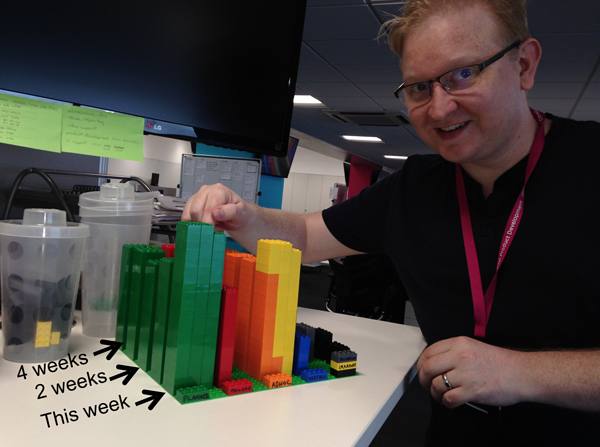
And here is five weeks of tracking data. You can see the impact our recent process improvements were having:
We put a key on it to remind folk what each column represented:
After the first four weeks we knew how much time we spent on planned work:
23.2%.
A paltry amount. The effort broke down as
| Planned | Failure | Ad-hoc | Meetings | |
|---|---|---|---|---|
| April | 23% | 30% | 40% | 2% |
As much as we liked to complain about meetings we didn’t spend much time in them.
Adhoc was the most significant problem. The team had a lot of juicy data, and no one else could access it. We got around this by sharing our data with another team of specialist reporters. They used a read-only version of our data to create reports on demand.
Failure demand was the next target. Our team didn’t have a tester and worked in a complex domain. After adding a tester to the team, we were able to quantify the impact the tester had as we watched the red bricks fall away.
Another breakthrough came when we analysed why we weren’t delivering what people wanted the first time around. It was a lack of feedback between the team and stakeholders. We started introducing extra demos with stakeholders. Getting earlier feedback from them about what they really wanted.
Seven months later the team had these figures:
| Planned | Failure | Ad-hoc | Meetings | |
|---|---|---|---|---|
| April | 23% | 30% | 40% | 2% |
| November | 56% | 4% | 24% | 10% |
We had more than doubled the time spent on planned work by banishing failure demand. But ad-hoc persisted. There’s still value in ad-hoc work, but we had tamed it to a reasonable amount.
The final interesting thing to note was that we spent five times more time in meetings. This was the demos with stakeholders. Spending an hour getting feedback was saving a day developing the wrong feature.
Nancy Van Schooenderwoert came over to visit us during this experiment. Afterwards, we collaborated to create a PDF for others to try this with their teams. You can get a copy here: Lego Workstream Visualisation guide.
Give it a try yourself, and please send me a tweet of your Lego creations. Good luck.