Synthetic Monitoring with Cypress
As an industry, we are experts at blasting non-production environments with test suites. But we are still amateurs at testing what matters: the environment your customers are using.
To fix this, one of the best testing moves you can make right now involves taking a journey test from your deployment pipeline and occasionally running it against your production environment.
Let’s think about how we monitor for a second.
You can put the ways we monitor our production environments into two categories:
- proactive: we create requests to monitor the status
- passive: we log customer requests to monitor the status
Parsing logs for errors or using an APM like NewRelic is passive as it is waiting for customers to find out if our systems are working as expected. They are a fantastic way of gaining insight - after something has gone wrong.
A proactive approach involves creating requests yourself against your services to check if they are working as expected. A rudimentary version of this exposes a /health endpoint called by your load balancers to cull misbehaving services. A second, and richer, way of doing this is simulating your services real-world usage via a web browser. This approach is called Synthetic Monitoring.
It’s like making a customer journey into a health check.
Combining a proactive approach like Synthetic Monitoring with a passive approach like an APM gives you an excellent platform for observing your applications.
So how does this work?
Synthetic Monitoring requires adding one more component into your traditional architecture which is dedicated to running the tests and producing reports.
In this example architecture, I’m assuming you are tracking service metrics with InfluxDb. But you can use something else or ignore that part entirely.
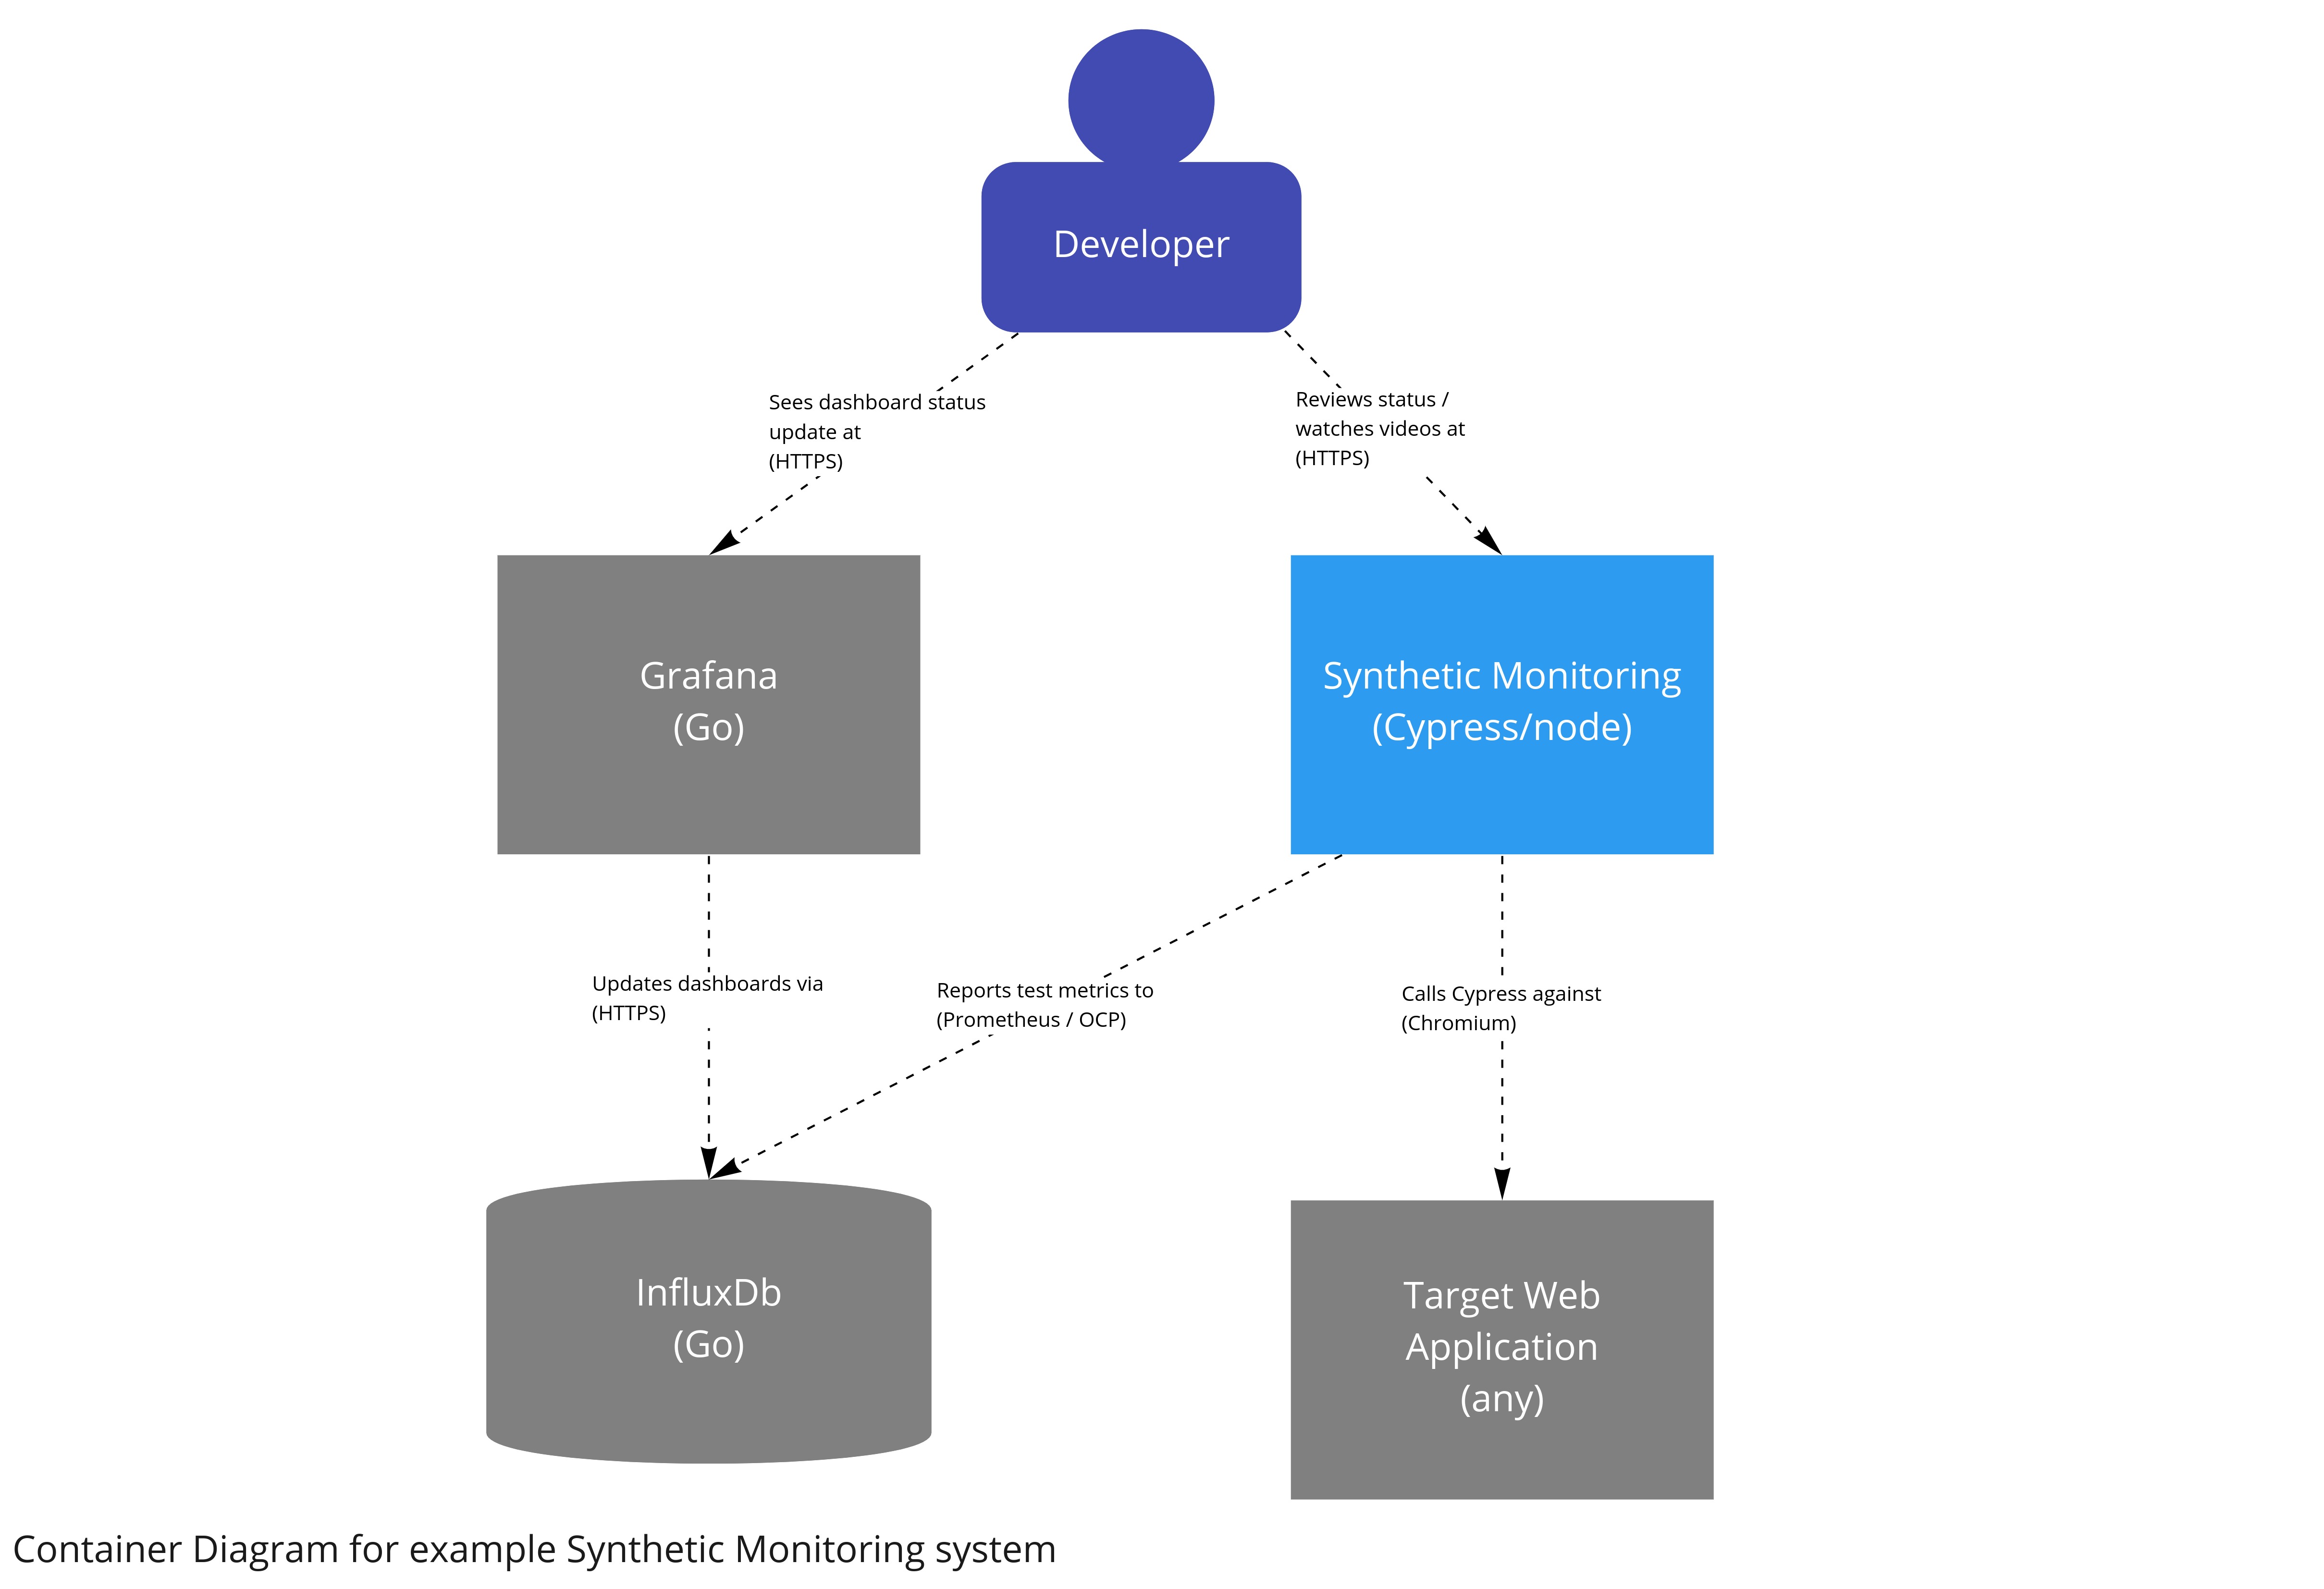
There are some services online that can perform Synthetic Monitoring for you, but sometimes it’s desirable to have control over the tests and execution environment. I’ve put together an example of how to run Cypress inside a microservice continuously against one of your environments.
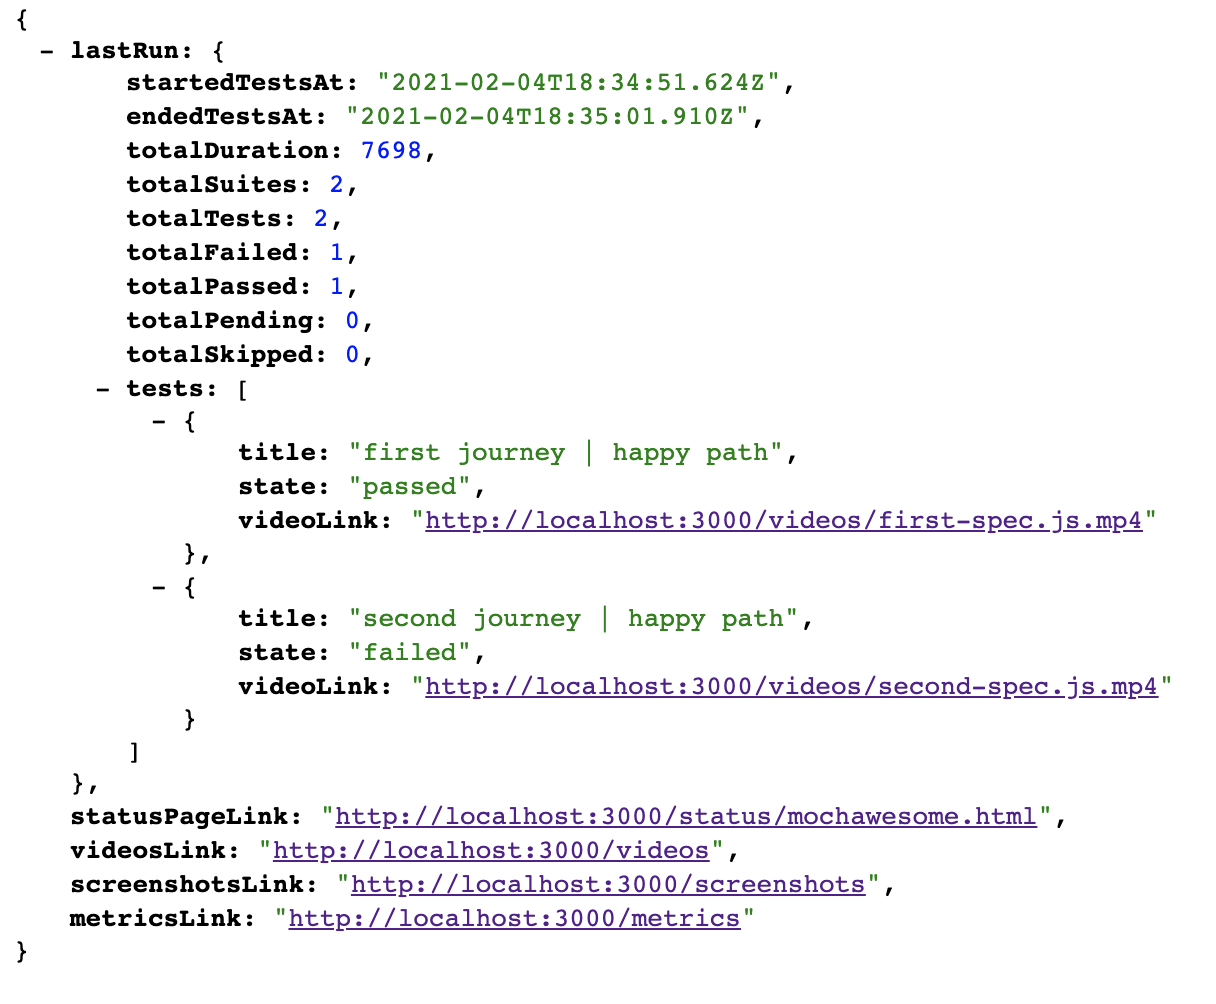
If you look over the code, you’ll notice only one non-Cypressy file in the repo: the server.js. This file contains an Express server which hooks into the Cypress module API with
const cypress = require("cypress")

cypress.run({
  config: {
    video: true,
  },
  spec: __dirname + "/cypress/integration/*-spec.js",
})
Along with some Express routes, the above code is wrapped in a while loop with a pause between test runs.
For inspection, I’ve added JSON API endpoints, Prometheus metrics and a fancy status page. The cherry on the top is the recorded videos of your most recent test run so you can quickly see what’s gone wrong.
So how can I get started?
Make a copy of the Github repo, then add one journey test through your application in the cypress folder. You can run the service via Docker, or by using Node.
But, what’s the catch?
Nothing comes for free, and you want to run these tests against your production environment, this will mean having discussions with your team about how you can safely get the test running. This work can involve:
- cleaning up the data it creates
- managing login accounts
- filtering the data out of any analytics reports
- considerations for third-party services
If you’ve already got a Cypress test running in your deployment pipeline, I will encourage you to use it as a seed for a Cypress based Synthetic Monitoring solution.
Wait! Testing in production?
If you remain unconvinced about running tests in production, check out the excellent series of articles by Cindy Sridharan.